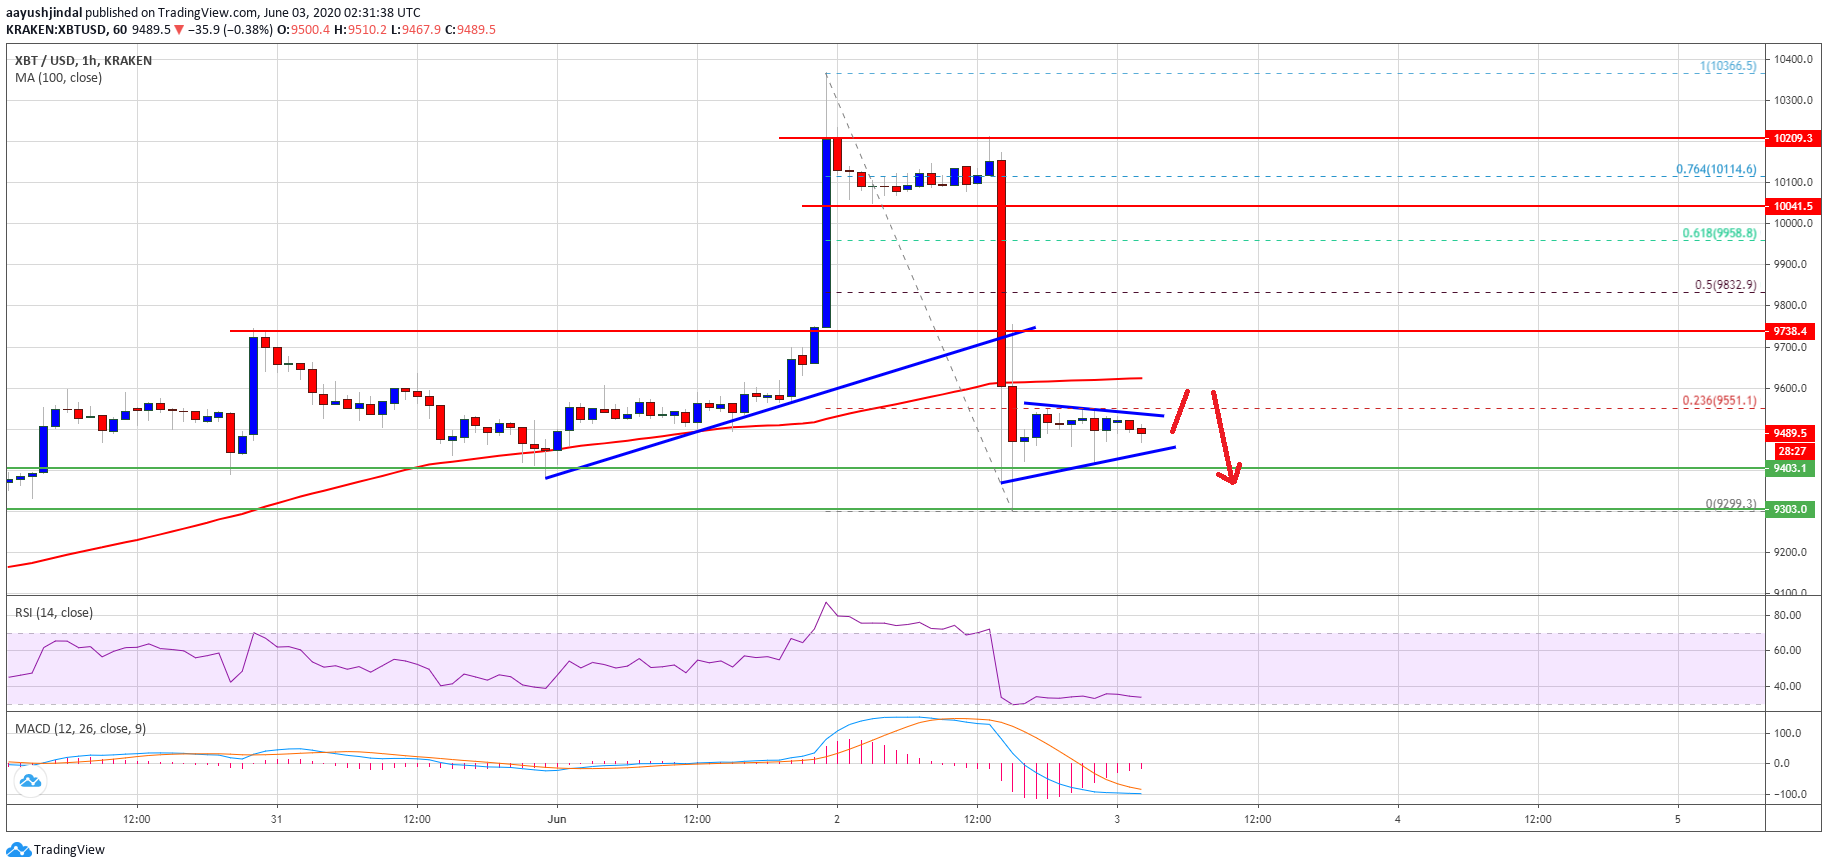
Bitcoin is down more than 6% and it trimmed most its gains above $10,000 against the US Dollar. BTC price is currently holding the key uptrend support at $9,300, but it is vulnerable to a larger decline.
- Bitcoin failed to continue higher and declined sharply below the $10,000 pivot level.
- The price broke many supports near the $9,740 and $9,500 levels.
- There was a break below a key bullish trend line with support near $9,735 on the hourly chart of the BTC/USD pair (data feed from Kraken).
- The pair is currently holding a crucial uptrend support near the $9,300 level.
Bitcoin Price Nosedives
After a strong upward move above $10,000, bitcoin price failed to continue higher against the US Dollar. BTC formed a short-term top near the $10,366 level and recently started a strong decline.
It broke many supports near the $10,000 and $9,740 levels to enter into a bearish zone. Moreover, there was a break below a key bullish trend line with support near $9,735 on the hourly chart of the BTC/USD pair.

Bitcoin Price
Bitcoin price is now trading well below $9,600 and the 100 hourly simple moving average. It tested the main uptrend support at $9,300 (the previous breakout zone) and traded as low as $9,299.
It is currently consolidating losses above the $9,300 and $9,400 support levels. An initial resistance is near the $9,550 level. It is close to the 23.6% Fib retracement level of the recent decline from the $10,366 high to $9,299 low.
It seems like there is a short term contracting triangle forming with resistance near $9,550 on the same chart. If there is an upside break above the $9,550 level, the price could face hurdles near the $9,600 level and the 100 hourly simple moving average.
The next major resistance is near the $9,740 level. The main hurdle is now forming near the $9,800 region or the 50% Fib retracement level of the recent decline from the $10,366 high to $9,299 low.
More Downsides in BTC?
The $9,300 support zone holds a lot of significance in the near term. If bitcoin fails to stay above the $9,300 support, it could spark another sharp decline.
An initial support is near the $9,000 level, below which there is a risk of a larger decline towards the $8,500 and $8,400 levels in the near term.
Technical indicators:
Hourly MACD – The MACD is slowly moving away from the bearish zone.
Hourly RSI (Relative Strength Index) – The RSI for BTC/USD is now well below the 40 level.
Major Support Levels – $9,400 followed by $9,300.
Major Resistance Levels – $9,550, $9,600 and $9,740.
Read more:Bitcoin Holds Strong at $9,300 But Turns Vulnerable For Bigger Decline | NewsBTC


