Bitcoin (BTC) price had a relatively muted day as the digital asset traded between $8,700-$8,885.┬Ā
Currently, the price remains below the ascending channel trendline and the daily candle closed as a neutral doji, showing bulls and bears are in contention on the direction Bitcoin will take over the short-term.┬Ā

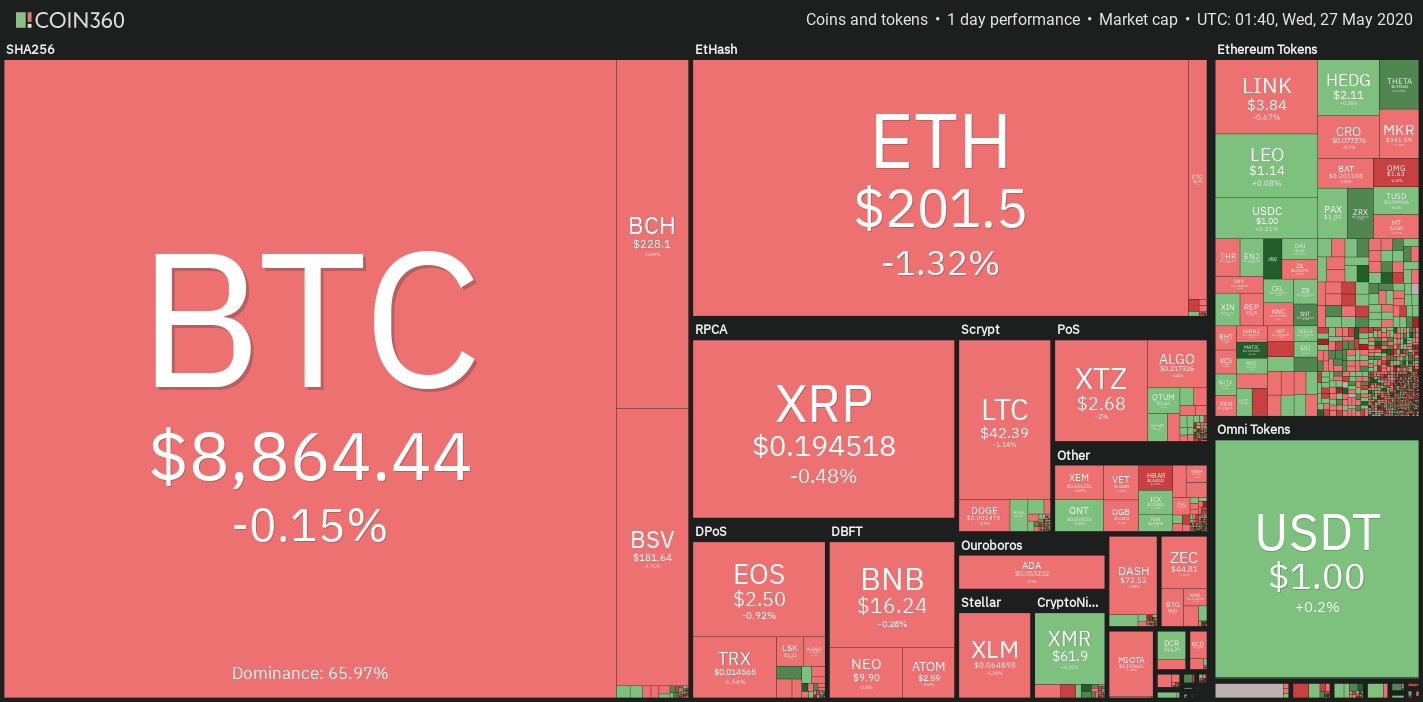
Crypto market weekly price chart. Source: Coin360
As the price searches for direction and its dominance rate drops from 67% to 65.5%, a handful of altcoins continued a multi-day streak of impressive double digit rallies.┬Ā
Despite Bitcoin price finding difficulty in reclaiming $9,000 and re-entering the ascending channel┬Ā Cointelegraph reported that the majority of top traders at Binance remain long on the top ranked digital asset on CoinMarketCap and a number of large cap altcoins.
Investor sentiment takes a knock
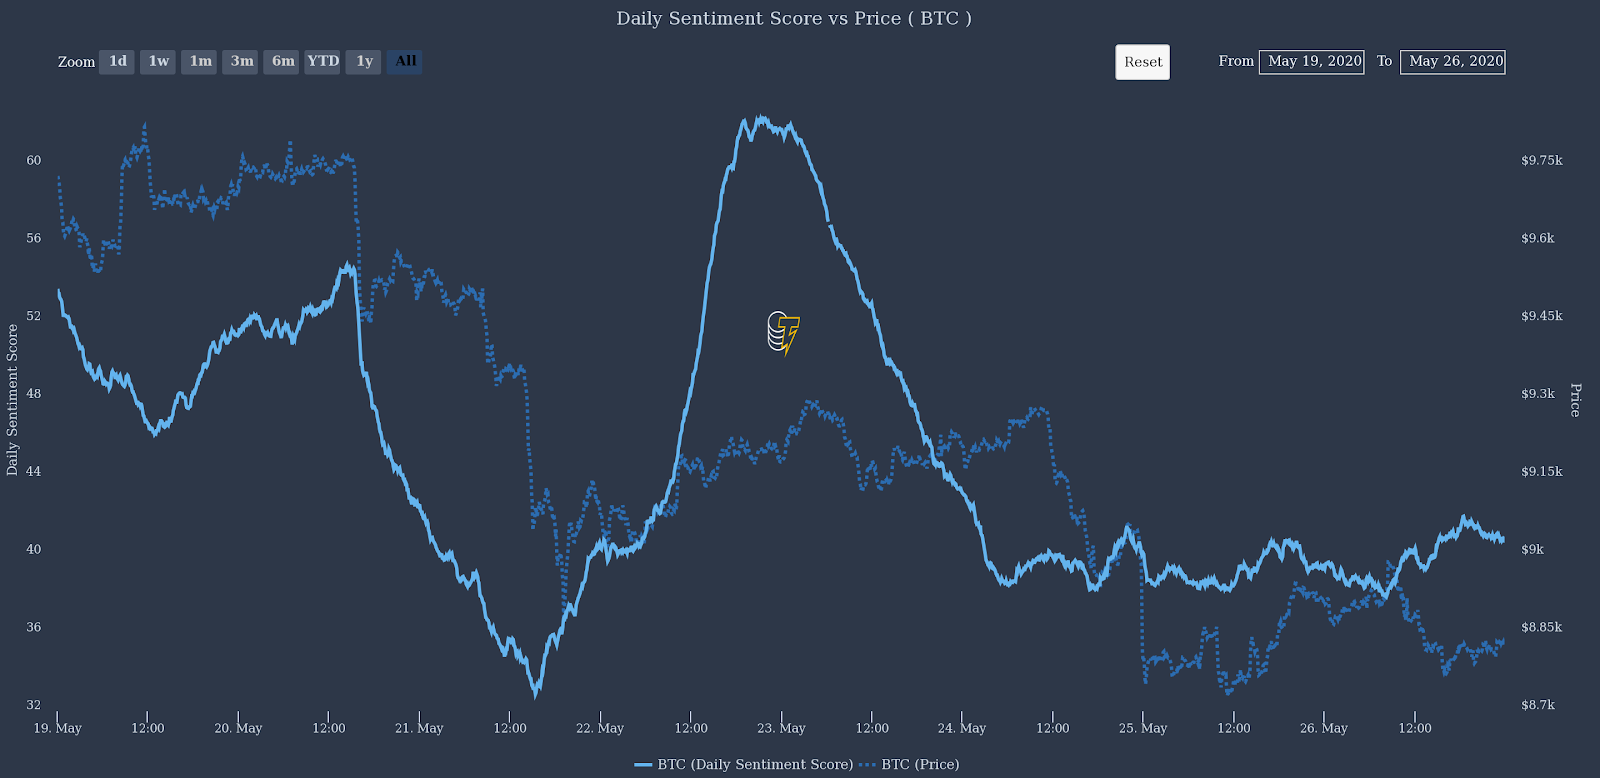
Interestingly, data from TheTIE, a crypto-oriented alternative data provider, shows that investors are growing increasingly bearish about the short-term price prospect of Bitcoin price.┬Ā

Daily Sentiment Score vs Price (BTC). Source: TheTie
As shown by the chart above, over the past week BitcoinŌĆÖs price drop corresponds with a drop in sentiment. TheTIE defines the daily sentiment score as ŌĆ£a measure of how positive or negative conversations on Twitter have been about a particular coin over the last 24 hours vs the previous 20 days. A score below 50 implied that conversations are becoming more negatives.ŌĆØ┬Ā
Previous analysis by Cointelegraph has uncovered the relationship between tweet volume, Bitcoin mentions, trading volumes and spot prices so keeping a gauge on crypto-related social activity is a practice many crypto investors find useful.┬Ā

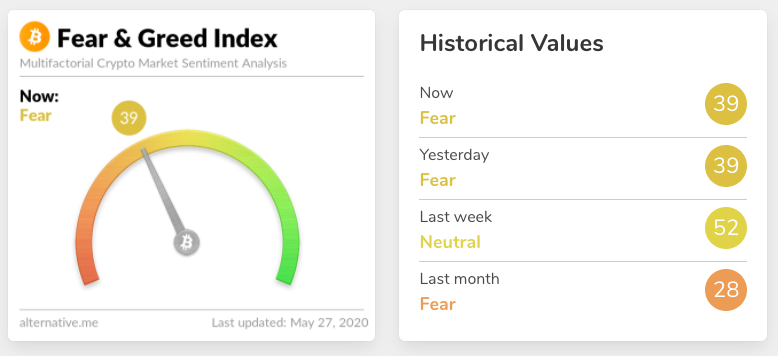
Crypto Fear & Greed Index. Source: Alternative.me
The Crypto Fear & Greed Index, another popular Bitcoin sentiment metric traders typically counter trade, also shows a sharp decrease in bullish investor sentiment. Currently the indicator reads ŌĆśFearŌĆÖ and is at 39, a sharp drop from last weekŌĆÖs ŌĆśNeutralŌĆÖ reading of 50.┬Ā
Last week as Bitcoin price repeatedly bounced off the ascending channel trendline investors felt some reassurance in the digital asset securing a close above $9,300 as the channel had provided strong support for more than two months. But, once the price closed last week below the channel bullish sentiment dropped.┬Ā
A close above the 20-MA is needed
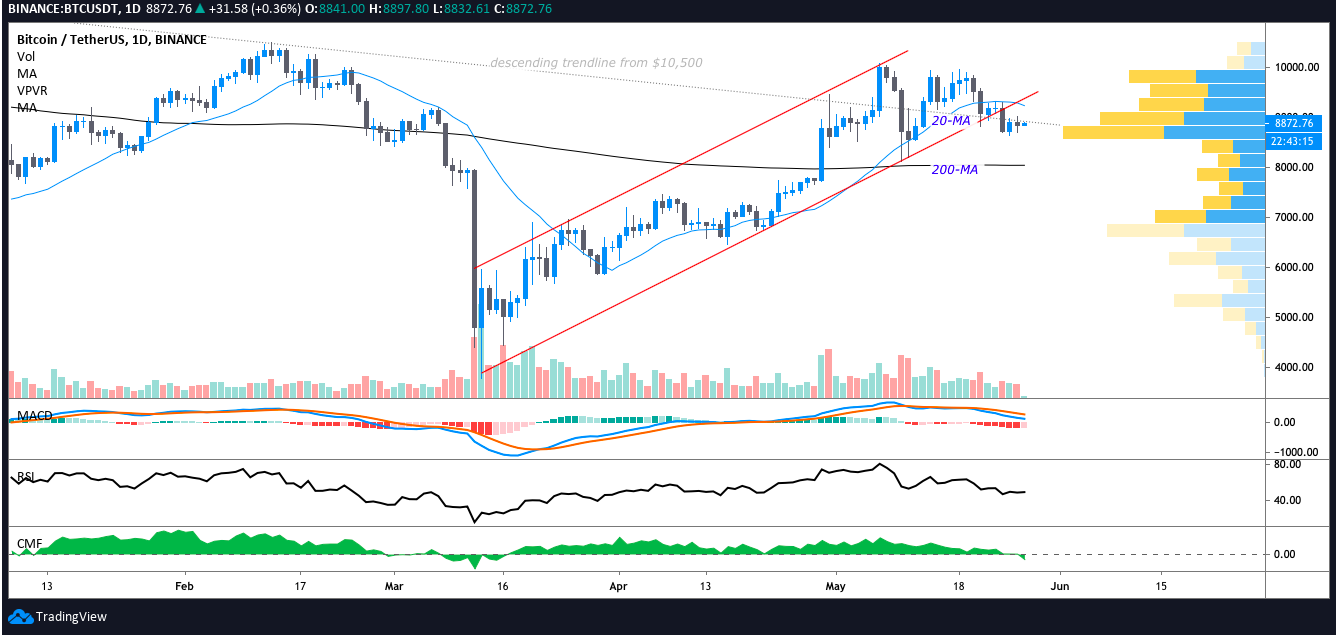
Despite remaining below the ascending channel and $9,000, Bitcoin price is beginning to notch daily higher lows and the MACD histogram hints at a decrease in bearish momentum.┬Ā
Even though reclaiming the $9K handle would be a positive development, the price now trades below the long-term descending trendline from the 2020 high at $10,500. A more encouraging sign would be for the price to close above the 20-day moving average at $9,240.┬Ā

BTC USDT daily chart. Source: TradingView
For the past few days $9,000 and $9,100 have been resistance levels the price struggles to overcome and the price has been pinned below the 20-MAŌĆ”
Read more:Bitcoin Price Caught Between Key Support Levels as Bearish Sentiment Grows


